Create some data
group <- rep(c('A1','A2', 'A3'), times=4)
value <- runif(12, 10, 20)
df1 <- data.frame(group, value)
df1

group <- rep(c('A1','A2', 'A3'), times=4)
value <- runif(12, 10, 20)
year <- as.factor(c(rep("2010",6), rep("2020",6)))
df2 <- data.frame(value,group,year) # dataframe
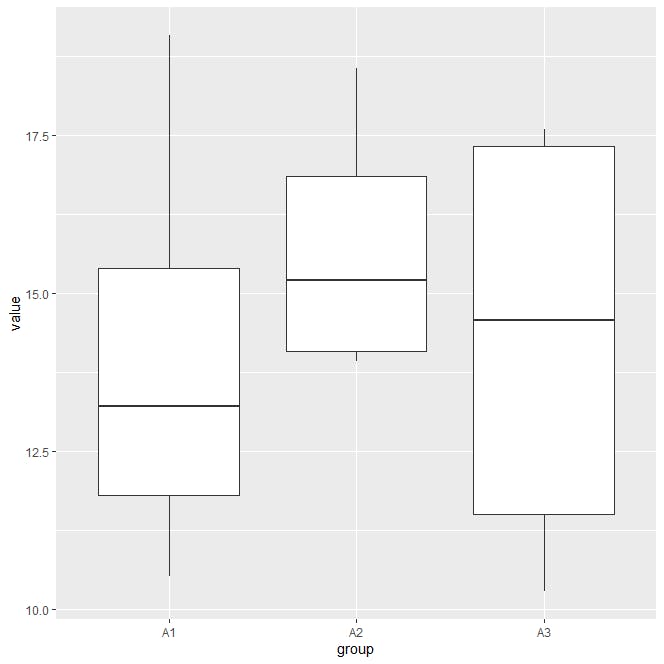
Visualize data:
library(ggplot2)
ggplot(df1, aes(x = group, y = value)) +
  geom_boxplot()

One-way ANOVA
It is used to examine statistically significant differences between means of two or more groups.
df1.anova <- aov(value ~ group, data=df1)
df1.anova
summary(df1.anova)

# extract the p-value and F value
summary(df1.anova)[[1]][1,4:5]
Interpretation of the result:
If the p-value is less than or equal to the chosen significance level (α), we reject the null hypothesis and conclude that there is a statistically significant difference between at least two group means.
If the p-value is greater than α, we fail to reject the null hypothesis and conclude that there is no statistically significant difference between group means.
The p-value of df1 is 0.9358, which is greater than 0.05. Therefore, we cannot reject the null hypothesis (means are equal) and conclude that the means are equal.
Two-way ANOVA
A two-way ANOVA has two independent variables. The syntax for a two-way ANOVA is:
aov(dependent ~ as.factor(independent1) * as.factor(independent2), data=filename)
df2.anova <- aov(value ~ group*year, data=df2)
summary(df2.anova)

# extract the p-value and F value:
summary(df2.anova)[[1]][1,4:5]
summary(df2.anova)[[1]][2,4:5]
summary(df2.anova)[[1]][3,4:5]
Analysis of Covariance
df2.anova <- aov(value ~ group+year, data=df2)
summary(df2.anova)

# extract the p-value and F value:
summary(df2.anova)[[1]][1,4:5]
TukeyHSD(df1.anova) #Tukey Honest Significant Differences
TukeyHSD(df2.anova)
If you enjoy the content, please consider subscribing to my YouTube channel for future updates.
To access video tutorials and receive a certificate, enroll in my Udemy course.