

Multiple linear regression (MLR) example:
fit <- lm(y ~ x1 + x2 + x3, data = mydata)
Download the data used in this tutorial.
Load data:
df<- read.csv("D:\\R4Researchers\\LAI_factors.csv")
View(df)
head(df)
Rename some long column names:
library(tidyverse)
df<- df %>%
  rename(
    lst = LST_India,
    temp = Mean_air_tem_India,
    precip = Total_precipitation_India,
    humid = Hum_India
  )
head(df)
MLR
fit1 <- lm(LAI_China ~ LST_China + Tem_China + Precipitation_China + Hum_China, data = df) #building model
fit2 <- lm(LAI_India ~ lst+ temp + precip + humid, data = df)

summary(fit1) # show results
coefficients(fit1) # model coefficients
confint(fit1, level=0.95) # CIs for model parameters
fitted(fit1) # predicted values
residuals(fit1) # residuals
anova(fit1) # anova table
vcov(fit1) # covariance matrix for model parameters
influence(fit1) # regression diagnostics

summary(fit2)
coefficients(fit2)
confint(fit2, level=0.95)
fitted(fit2)
residuals(fit2)
anova(fit2)
vcov(fit2)
influence(fit2)
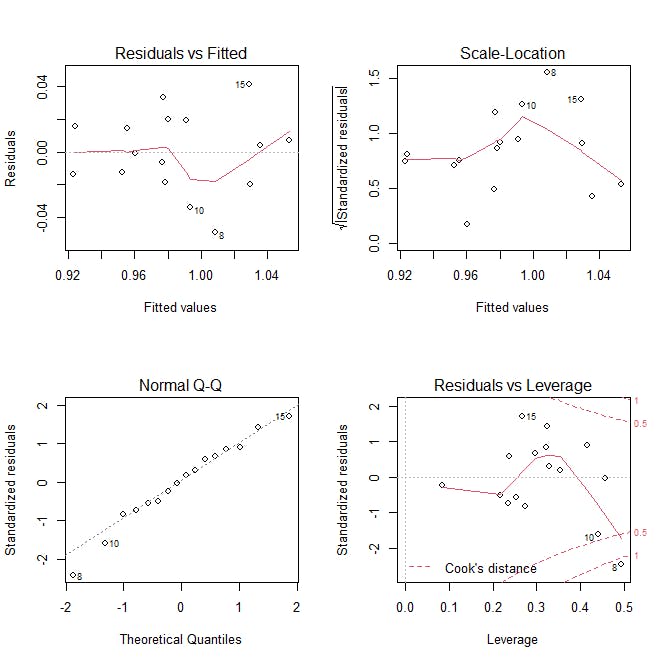
Diagnostic plots:
Check for heteroscedasticity, normality, and influential observations
layout(matrix(c(1,2,3,4),2,2)) # optional 4 graphs/page
plot(fit1)
Remove insignificant variables from the model:
fit3 <- lm(LAI_India ~ lst+ temp , data = df)
coefficients(fit3)
#(Intercept)         lst        temp
# 1.2433245  -0.1124670   0.1154845
Interpret the results:
In our example, it can be seen that the p-value of the F-statistic (fit2) is 0.004692, which is significant. This means that at least one of the predictor variables is significantly related to the outcome variable.
LAI in India is significantly associated with lst and air temperature. Decreasing one degree of lst and increasing air temperature leads to an increase of 0.12 units in LAI.
Model accuracy assessment:
We can use R2 and Residual Standard Error (RSE) in the summary. An R2 value close to 1 indicates that the model explains a large portion of the variance in the outcome variable. While the RSE provides a measure of the prediction error.
Extracting R-squared:
summary(fit3)$r.squared
# 0.6575707
summary(fit3)$adj.r.squared
# 0.6048892
If you enjoy the content, please consider subscribing to my YouTube channel for future updates.
To access video tutorials and receive a certificate, enroll in my Udemy course.