

Install and load packages (DataExplorer, datasets, ggplot2):
#install.packages("DataExplorer")
# Load library
library(DataExplorer) # load DataExplorer
library(datasets)
library(ggplot2)
Download the data files LAI_factors.csv and Countries_LAI_and_LST.csv.
Read in datasets:
dt1<-read.csv(file.path('D:', 'R4Researchers', 'Countries_LAI_and_LST.csv'))
dt2<-read.csv(file.path('D:', 'R4Researchers', 'LAI_factors.csv'))
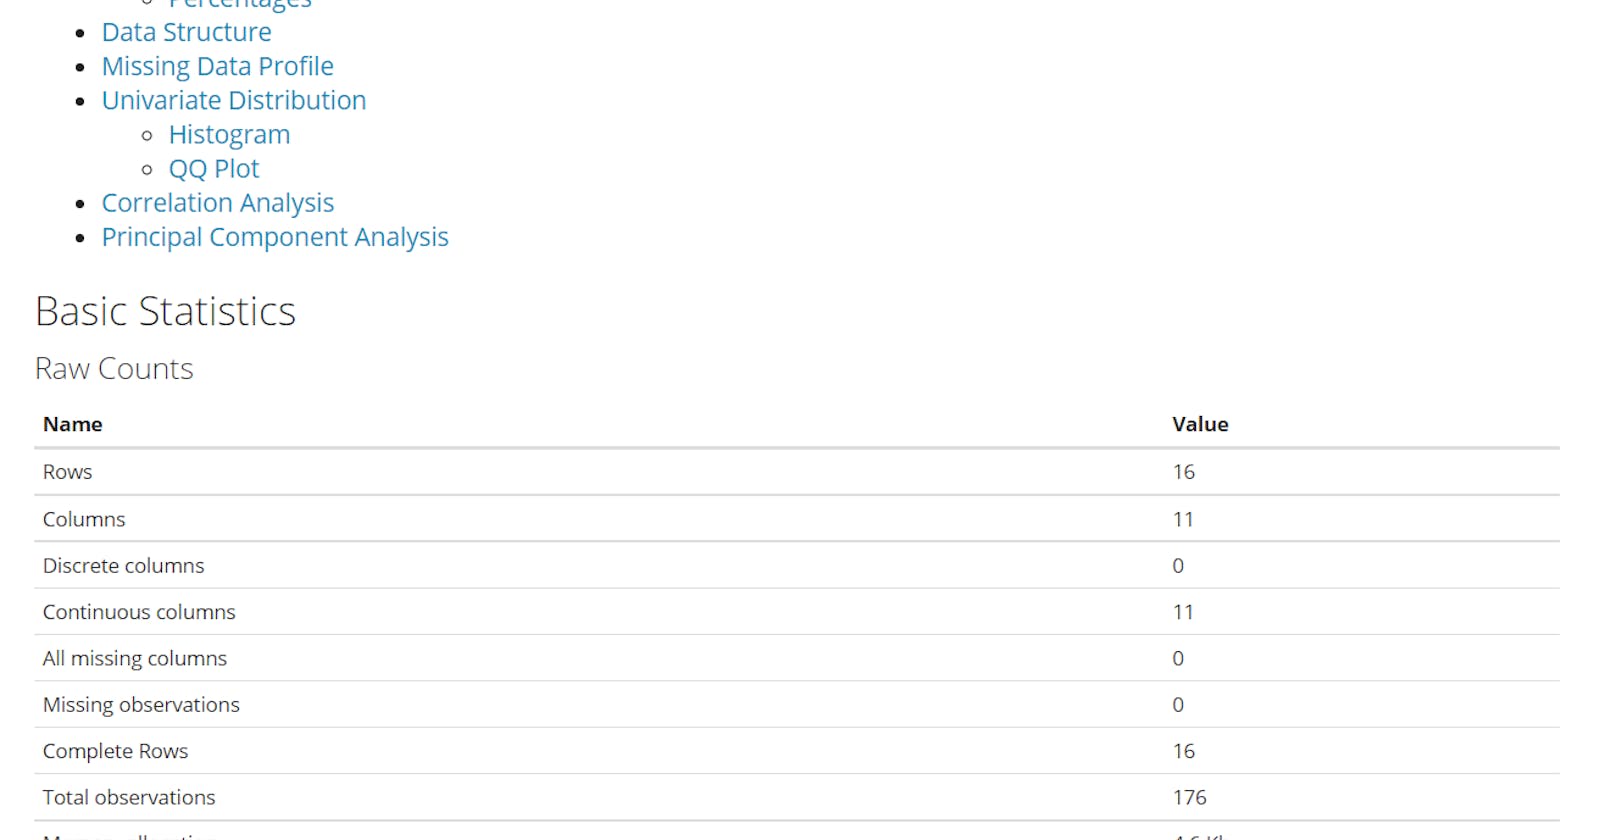
introduce(airquality) # to describe basic information
introduce(dt1)
plot_bar(mtcars)
plot_boxplot(iris, by = "Species", ncol = 2L)
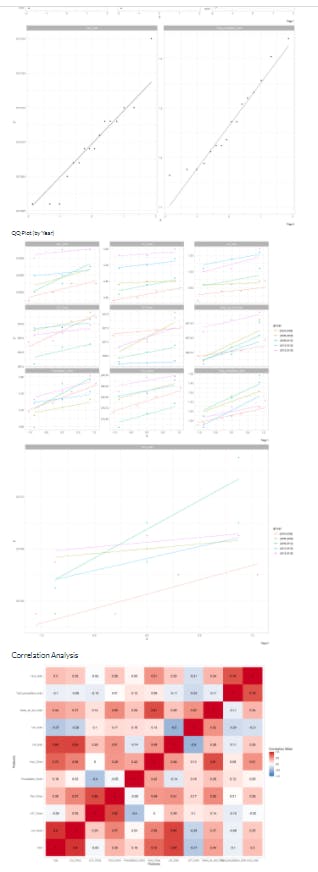
plot_correlation(iris)
plot_histogram(iris, ncol = 2L)
plot_prcomp(na.omit(airquality), nrow = 2L, ncol = 2L) # Visualize principal component analysis
plot_qq(iris) # plot quantile-quantile for each continuous feature
plot_scatterplot(iris, by = "Species") # create scatterplot for all features
plot_str(iris) # visualize data structure
Create a report
create_report(iris)
create_report(airquality, y = "Ozone")

create_report(dt1)
plot_histogram(dt1)

create_report(dt2)
plot_histogram(dt2)
Create customized report
create_report(
  data = dt2,
  output_format = html_document(toc = TRUE, toc_depth = 6, theme = "flatly"),
  output_file = "report_LAI_factors.html",
  output_dir = getwd(),
  y = "Year",
  config = configure_report(
    add_plot_prcomp = TRUE,
    plot_qq_args = list("by" = "Year", sampled_rows = 1000L),
    plot_bar_args = list("with" = "LAI_India"),
    plot_correlation_args = list("cor_args" = list("use" = "pairwise.complete.obs")),
    plot_boxplot_args = list("by" = "LST_India"),
    global_ggtheme = quote(theme_light())
  )
)
The output will be saved in the specified directory as an HTML file.
If you enjoy the content, please consider subscribing to my YouTube channel for future updates.
To access video tutorials and receive a certificate, enroll in my Udemy course.