

Load trees data from datasets library
library(datasets)
tr<-trees
head(tr)
Histogram
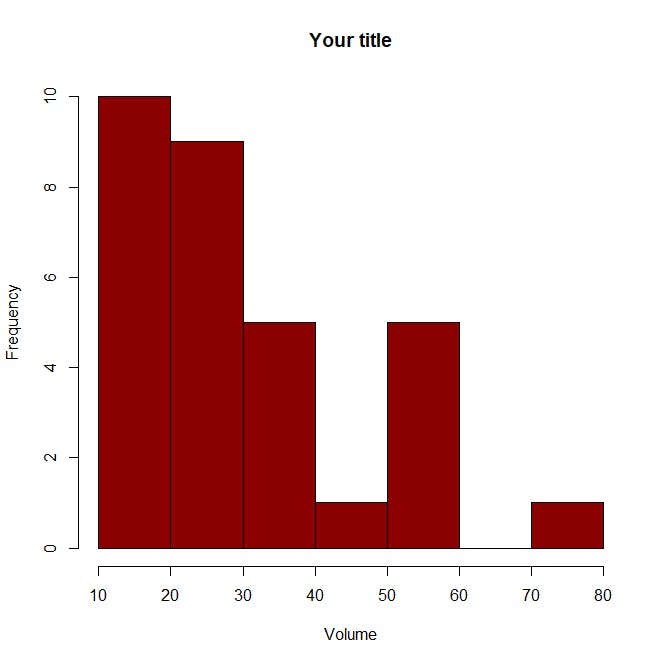
hist(tr$Volume, col = 'darkred',main="Your title", xlab="Volume")
Barplot
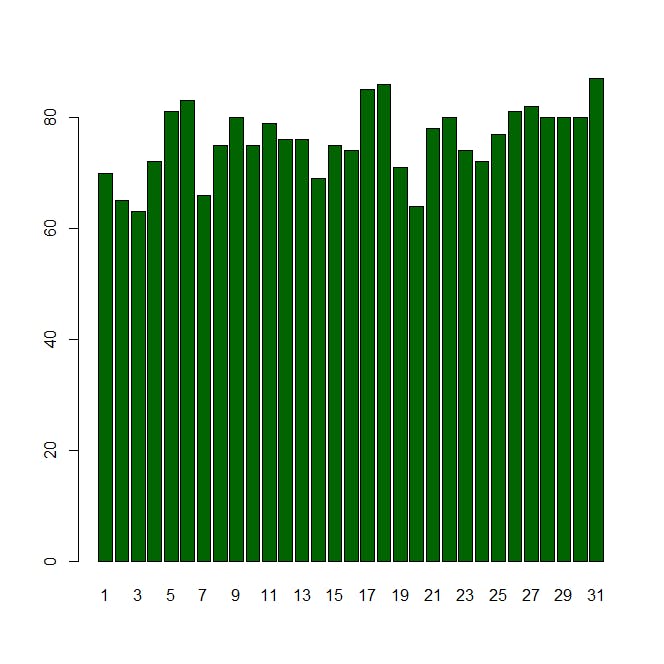
barplot(tr$Height, names.arg=c(1:31), col='darkgreen')
Boxplot
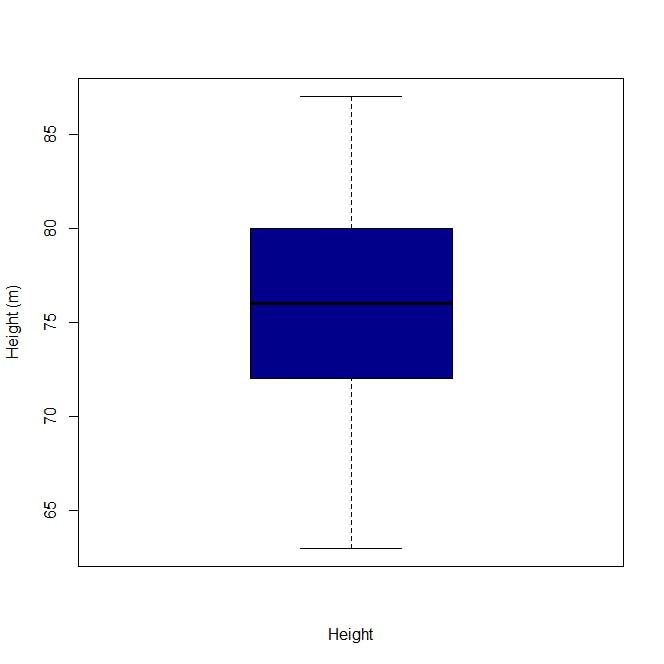
boxplot(tr$Height, col = 'darkblue', xlab='Height',ylab='Height (m)')
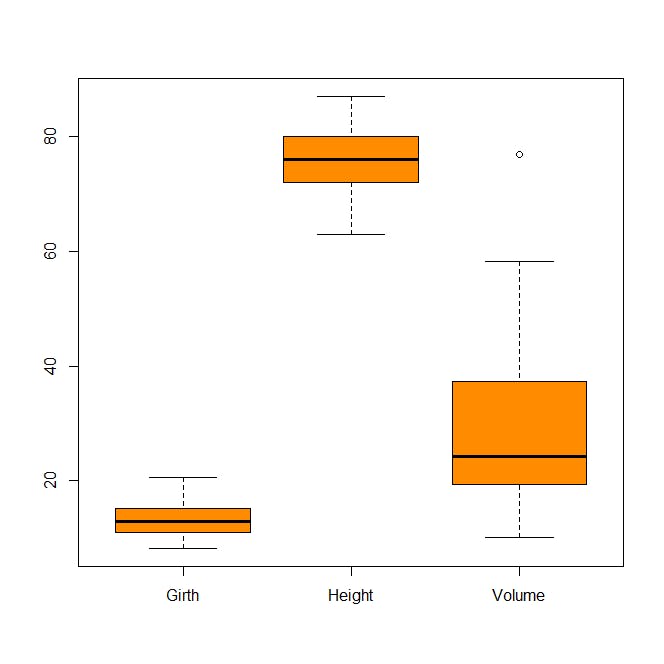
boxplot(tr, col='darkorange')
Scatter plot
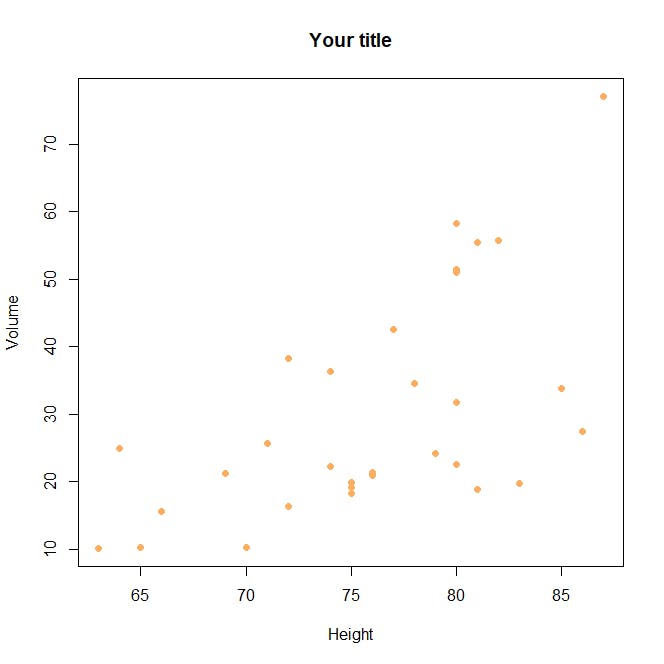
plot(tr$Height, tr$Volume, col='#FDAE61', pch=19, xlab='Height', ylab=
      'Volume', main='Your title')
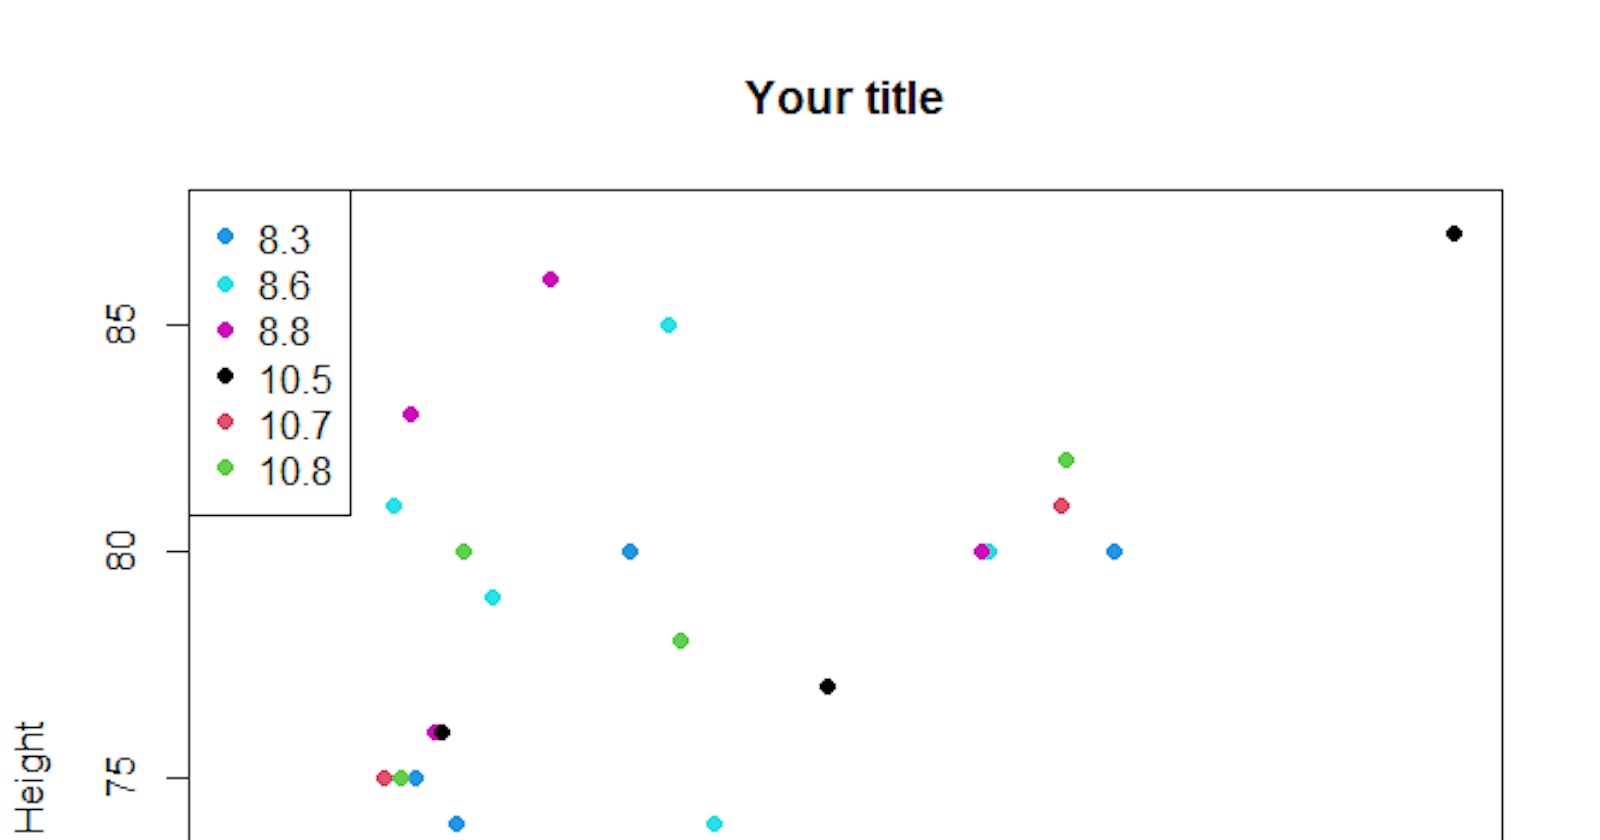
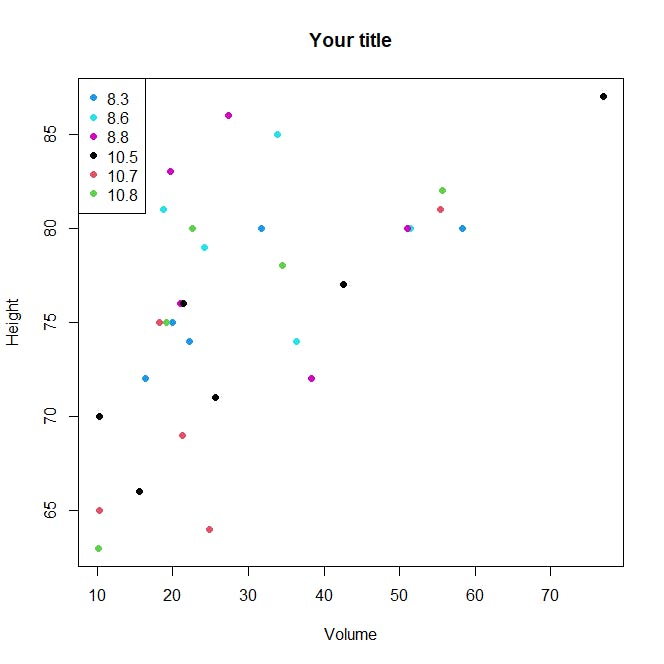
plot(tr$Volume,tr$Height, col = factor(tr$Girth[1:6]), pch=19,
     xlab='Volume', ylab='Height', main='Your title')

# Legend
legend("topleft",
       legend = levels(factor(tr$Girth[1:6])),
       pch = 19,
       col = factor(levels(factor(tr$Girth[1:6]))))
Line graph
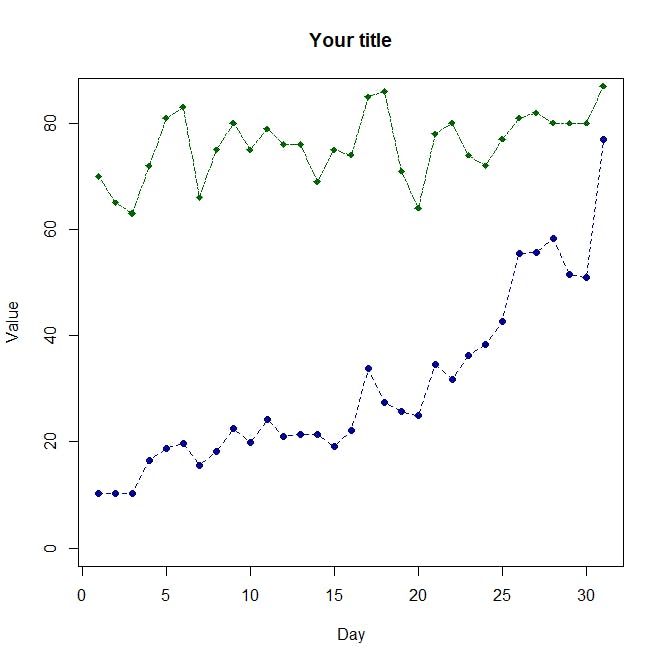
plot(tr$Height,type = "o",col = "darkgreen", xlab = "Day", ylab = "Value",
     main = "Your title", ylim = c(0, 85), pch=18, lty=6)
lines(tr$Volume, type = "o", col = "darkblue", pch=19, lty=2)
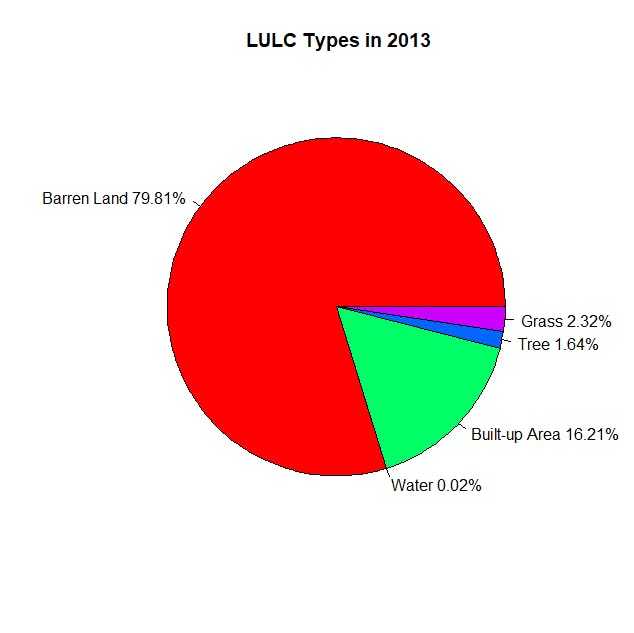
Pie chart
piedata <-c(79.814, 0.023, 16.21, 1.636, 2.318)
class <- c("Barren Land", "Water", "Built-up Area", "Tree", "Grass")
pct <- round(piedata/sum(piedata)*100, 2)
class <- paste(class, pct)
class <- paste(class,"%",sep="")
pie(piedata,labels = class, col=rainbow(5), main="LULC Types in 2013")
If you enjoy the content, please consider subscribing to my YouTube channel for future updates.
To access video tutorials and receive a certificate, enroll in my Udemy course.