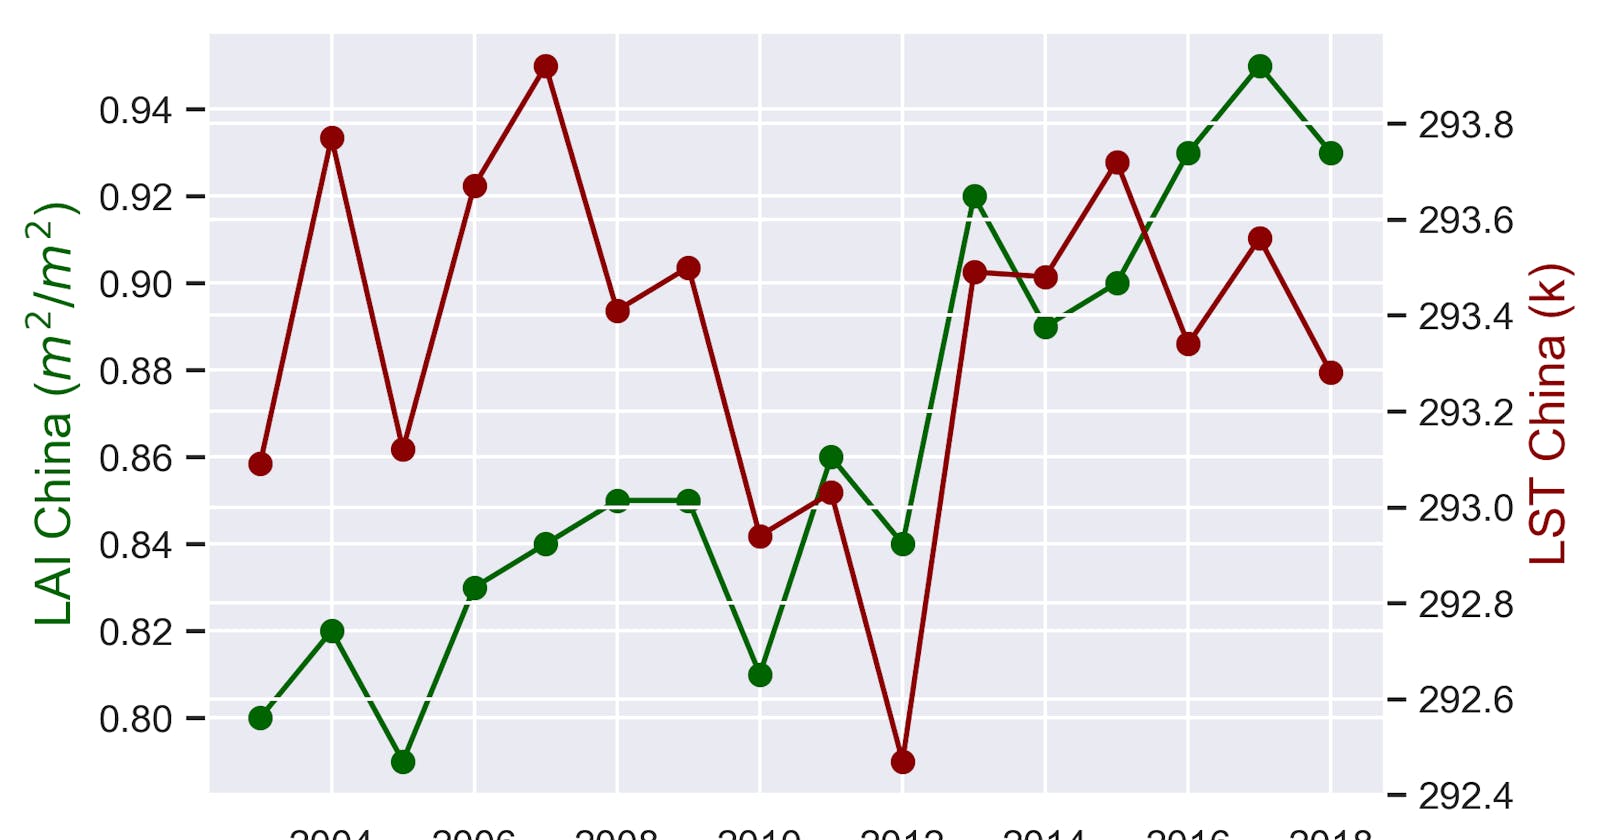
Firstly, download the data used in the case study
Then, import the necessary libraries and functions.:
import numpy as np # Used for numerical calculations
import pandas as pd # Used for creating and analyzing dataframes
import seaborn as sns # Used for plotting
import matplotlib  # Used for plotting
import matplotlib.pyplot as plt
import statsmodels.api as sm # Used for modeling purpose
from sklearn.linear_model import LinearRegression # Used for modeling purpose
from sklearn.impute import SimpleImputer
from scipy.stats import shapiro
from statsmodels.graphics.gofplots import qqplot
Read the dataset using the read.csv() function
dataset=pd.read_csv(r'D:\Python\Python_for_Researchers\LAI_case_study\Countries_LAI_and_LST.csv', encoding='unicode_escape')
df = dataset[['Year', 'LAI_China', 'LST_China', 'LAI_India', 'LST_India']]

df.head(5)
Convert the Year column from float to integer.
cols = ['Year']
df[cols] = df[cols].applymap(np.int64) # only convert Year column to interger other columns stay as float
print(df)
Get information about the data:
df.info() #It returns range, column, number of non-null objects of each column, datatype and memory usage.
"""
<class 'pandas.core.frame.DataFrame'>
RangeIndex: 16 entries, 0 to 15
Data columns (total 5 columns):
Year         16 non-null int64
LAI_China    16 non-null float64
LST_China    16 non-null float64
LAI_India    16 non-null float64
LST_India    16 non-null float64
dtypes: float64(4), int64(1)
memory usage: 720.0 bytes
"""
df.count()#It results in a number of non null values in each column.
"""
Year         16
LAI_China    16
LST_China    16
LAI_India    16
LST_India    16
dtype: int64
"""
Get descriptive statistics:
df.describe()#summarize the central tendency, dispersion, and shape of a dataset’s distribution, excluding NaN values

df.shape #It returns a number of rows and columns in a dataset.
Check the number of null values
df.isnull().sum() # It returns a number of null values in each column.
"""
Year         0
LAI_China    0
LST_China    0
LAI_India    0
LST_India    0
dtype: int64
"""
Handle missing values, if any:
COLS=['Year', 'LAI_China', 'LST_China', 'LAI_India', 'LST_India'] # select columns

# invoking SimplerInmputer to fill missing values
imputer = SimpleImputer(missing_values=np.nan, strategy='mean') # mean based filling
df[COLS] = imputer.fit_transform(df[COLS])
df.head(5)
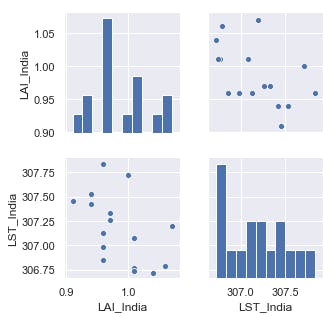
Display the data as a pairplot
sns.set()
cols=['LAI_India', 'LST_India']
sns.pairplot(df[cols], size=2.3)
Reindex columns
df = df.reindex(columns=['Year','LAI_China','LST_China', 'LAI_India', 'LST_India'])
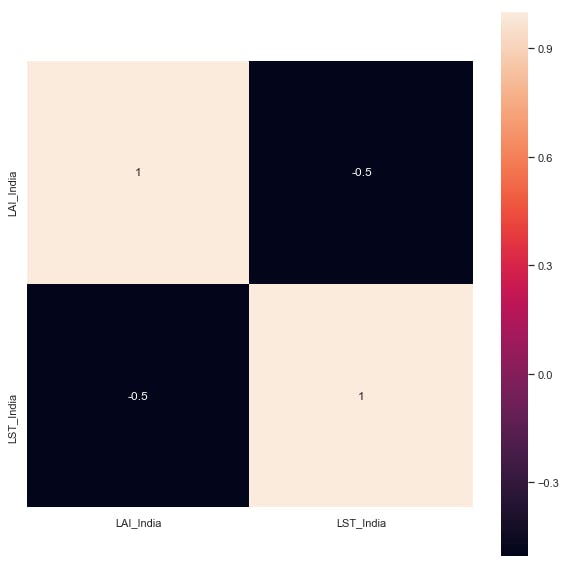
Create a heatmap:
corrmat=df[clos].corr()
f, ax=plt.subplots(figsize= (10, 10))
sns.heatmap(corrmat,vmax = 1,square = True, annot = True)
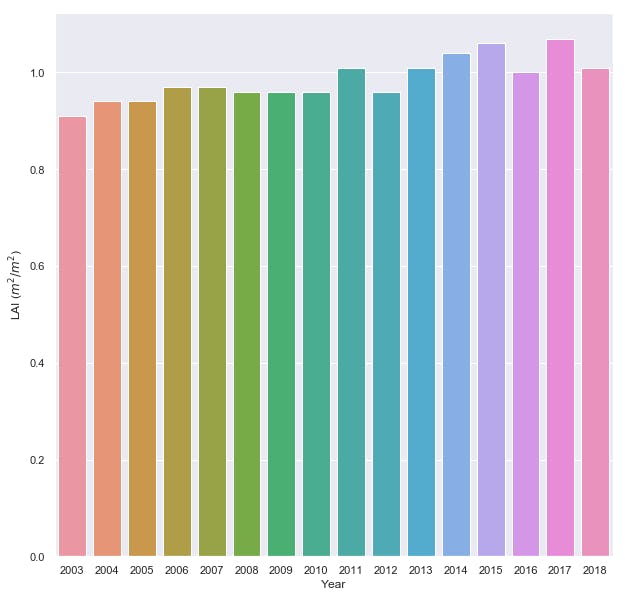
Create a barplot for LAI in India:
f, ax=plt.subplots(figsize= (10, 10))
sns.barplot(data=df, x= 'Year', y='LAI_India')
plt.gca().set(ylabel='LAI ($m^2/m^2$)', xlabel='Year')
Perform Simple Linear Regression:
x = np.array(df['LAI_China']).reshape(-1, 1)
y = np.array(df['LST_China']).reshape(-1, 1)
df.dropna(inplace=True)
regr = LinearRegression()
regr.fit(x, y)
print(regr.score(x, y))

# 0.06287502532051603

x = np.array(df['LAI_India']).reshape(-1, 1)
y = np.array(df['LST_India']).reshape(-1, 1)
df.dropna(inplace=True)
regr = LinearRegression()
regr.fit(x, y)
print(regr.score(x, y))
# 0.25359358245004393

print('Intercept: \n', regr.intercept_)
print('Coefficients: \n', regr.coef_)
"""
Intercept:
 [311.0893524]
Coefficients:
 [[-3.97017365]]
"""
Perform OLS model
model = sm.OLS(y, x).fit()
predictions = model.predict(x)
print_model = model.summary()
print(print_model)
"""
OLS Regression Results
=======================================================================

Dep. Variable:                      y   R-squared:                       0.998
Model:                            OLS   Adj. R-squared:                  0.998
Method:                 Least Squares   F-statistic:                     7426.
Date:                Tue, 06 Jul 2021   Prob (F-statistic):           1.23e-21
Time:                        02:01:38   Log-Likelihood:                -64.688
No. Observations:                  16   AIC:                             131.4
Df Residuals:                      15   BIC:                             132.1
Df Model:                           1
Covariance Type:            nonrobust
=======================================================================
                 coef    std err          t      P>|t|      [0.025      0.975]
------------------------------------------------------------------------------
x1           311.0363      3.609     86.177      0.000     303.343     318.729
=======================================================================
Omnibus:                        0.748   Durbin-Watson:                   0.752
Prob(Omnibus):                  0.688   Jarque-Bera (JB):                0.742
Skew:                          -0.381   Prob(JB):                        0.690
Kurtosis:                       2.270   Cond. No.                         1.00
=========================================================================
"""
Check the distribution of the data:
sns.lmplot(x = 'LAI_India', y = 'LST_India', data = df, order=2, ci=None)
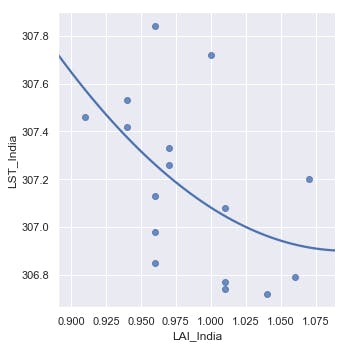
The plot shows that the data is negatively skewed
Check normality using the Shapiro-Wilk test:
x = (df['LAI_India'])

stat, p=shapiro(x)
print(stat, p)

# 0.9437444806098938  0.39743494987487793
Check the distribution of the data
alpha = 0.05
if p > alpha:
    print('Sample looks Gaussian (fail to reject H0)')
else:
    print('sample does not look Gaussian (reject H0)')
# Sample looks Gaussian (fail to reject H0)
Visualize the data using a histogram
plt.title('Histogram for normality check')
sns.set_style('darkgrid') # set grid style
his = sns.distplot(x)
his.set_xlabel('Value', fontsize=12) # set x label
his.set_ylabel('Frequency', fontsize=12) # set y label
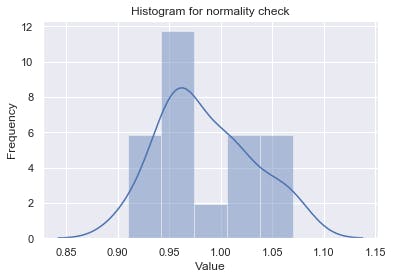
Visualize the data using a QQ plot (Quantile-Quantile Plot):
qqplot(x, line='s')
plt.show()
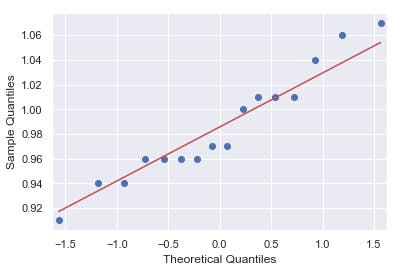
The QQ plot shows a scatter plot of points in a diagonal line.
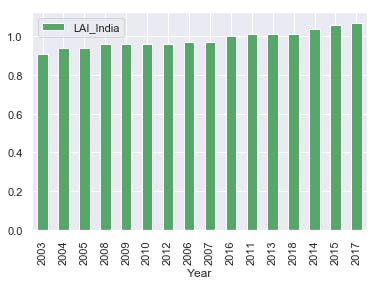
Create a barplot of the data:
df[['LAI_India', 'Year']].groupby(['Year']).median().sort_values('LAI_India', ascending = True).plot.bar(color='g')
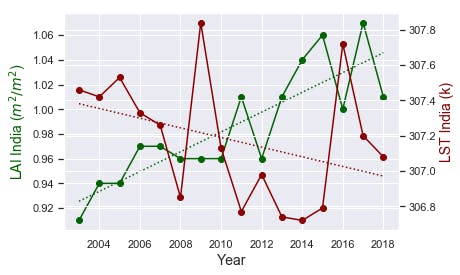
Plot LST and LAI as a timeline against each other with two y-axes.
# create figure and axis objects with subplots()
fig,ax = plt.subplots()
# make a plot
ax.plot(df.Year, df.LAI_India, color="darkgreen", marker="o")
z = np.polyfit(df.Year, df.LAI_India, 1)
p = np.poly1d(z) # It is ploy1(one)d
plt.plot(df.Year, p(df.Year), 'darkgreen', linestyle= 'dotted')
# set x-axis label
ax.set_xlabel("Year",fontsize=14)
# set y-axis label
ax.set_ylabel("LAI India ($m^2/m^2$)",color="darkgreen",fontsize=14)
#plt.legend()
##############
ax2=ax.twinx()
# make a plot with different y-axis using second axis object
ax2.plot(df.Year, df.LST_India,color="darkred",marker="o")
ax2.set_ylabel("LST India (k)",color="darkred",fontsize=14)
z = np.polyfit(df.Year, df.LST_India, 1)
p = np.poly1d(z) # It is ploy1(one)d
plt.plot(df.Year, p(df.Year), 'darkred', linestyle= 'dotted')
#plt.legend()
plt.show()
#####
# save the plot as a file
fig.savefig('two_different_y_axis_for_single_python_plot_with_twinx_India.png',
            format='png',
            dpi=300,
           bbox_inches='tight')
fig,ax = plt.subplots()
# make a plot
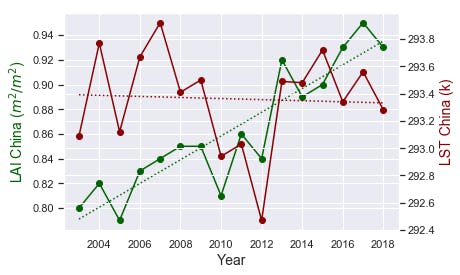
ax.plot(df.Year, df.LAI_China, color="darkgreen", marker="o")
z = np.polyfit(df.Year, df.LAI_China, 1)
p = np.poly1d(z) # It is ploy1(one)d
plt.plot(df.Year, p(df.Year), 'darkgreen', linestyle= 'dotted')

# set x-axis label
ax.set_xlabel("Year",fontsize=14)
# set y-axis label
ax.set_ylabel("LAI China ($m^2/m^2$)",color="darkgreen",fontsize=14)
#plt.legend()
##############
ax2=ax.twinx()
# make a plot with different y-axis using second axis object
ax2.plot(df.Year, df.LST_China,color="darkred",marker="o")
ax2.set_ylabel("LST China (k)",color="darkred",fontsize=14)
z = np.polyfit(df.Year, df.LST_China, 1)
p = np.poly1d(z) # It is ploy1(one)d
plt.plot(df.Year, p(df.Year), 'darkred', linestyle= 'dotted')
plt.show()
#####
# save the plot as a file
fig.savefig('two_different_y_axis_for_single_python_plot_with_twinx_China.png',
            format='png',
            dpi=300,
           bbox_inches='tight')
Detect increasing or decreasing trends in the time series.
def trendline(index,data, order=1):
    coeffs = np.polyfit(index, list(data), order)
    slope = coeffs[-2]
    return float(slope)

index=df.Year
List=df.LAI_India
#List=df.LST_India
resultent=trendline(index,List)
trendp = resultent*16
print(resultent, trendp)
# 0.008014705882353073 0.12823529411764917
References that helped me while writing my tutorial series
If you find this content helpful, please consider SUBSCRIBING to my channel for future updates.
If you would like to get the full video tutorial and a certificate, you can enroll in the course by following this link: https://www.udemy.com/course/python-for-researchers/?referralCode=886CCF5C552567F1C4E7
