Learning Python QGIS.
1- Open Python console:
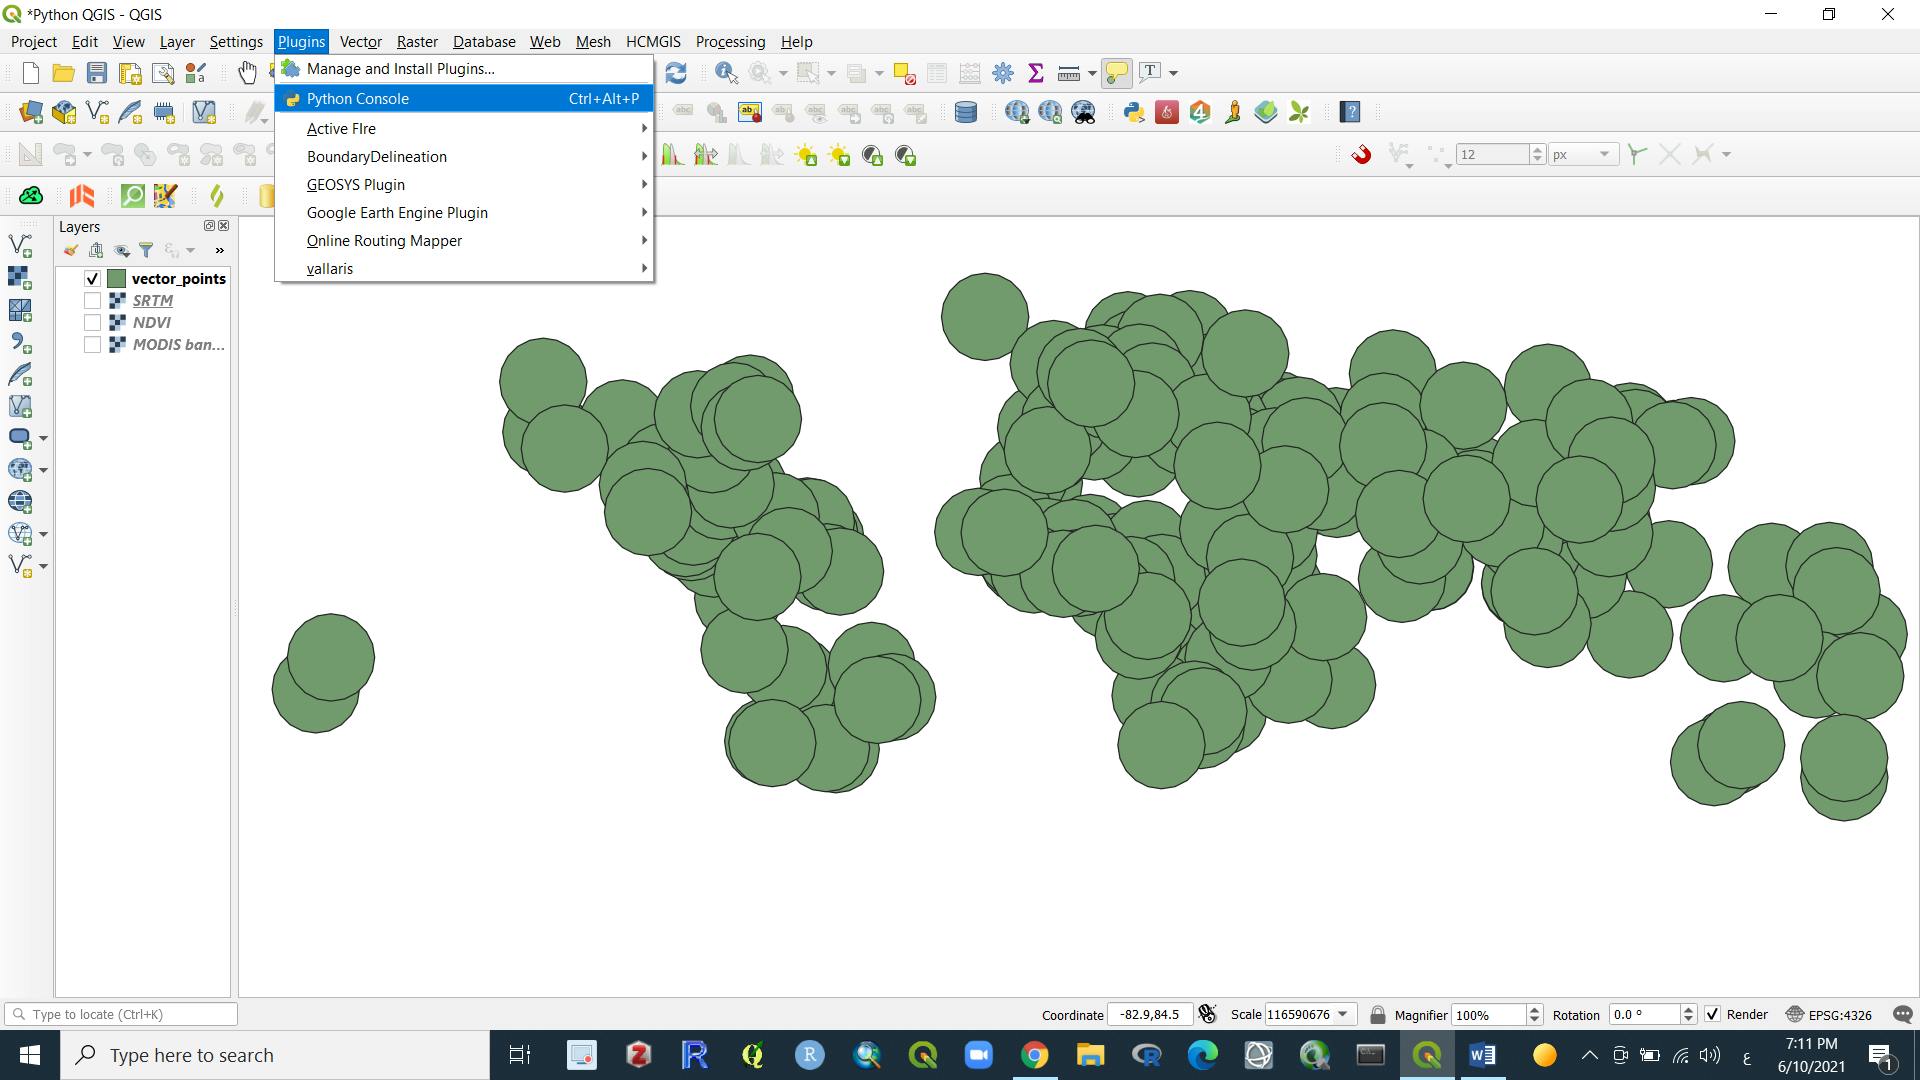
QGIS provides Python console for scripting. You can open it from the: Plugins ► Python Console menu.

2- Typing in Python console:
In the Python console use print() function to write.
Print("Hello My Dear Learner!")
Then click "Enter"

3- Writing script on "Script editor":
For long scripts, you can use Script editor.
To open it, click on 'Show Editor".

4- Loading a vector layer
You can download the data that we are using.
Then, get the path of the shapefile
uri = "D:/Python_QGIS/data/Countries.shp"
The format is:
vlayer = iface.addVectorLayer(data_source, layer_name, provider_name)
iface.addVectorLayer(uri, "countries", "ogr")
5- Loading raster files:
For loading raster files, GDAL library is used.
Firstly, download the data.
Then, get the path of the raster file:
uri = "D:/Python_QGIS/data/dem_subset.tif"
Now add the layer
The format is:
rlayer = iface.addRasterLayer(data_source, layer_name, provider_name)
rlayer = iface.addRasterLayer(uri, "my_raster", "gdal")
6- Retrieving information of vector layer:
We use fields() on a QgsVectorLayer to retrieve information about the fields of a vector layer.
uri = "D:/Python_QGIS/data/Countries.shp"
vlayer = QgsVectorLayer(uri, "Countries", "ogr")

for field in vlayer.fields():
        print(field.name())
7- Show attribute table of a vector layer
We can use iface.showAttributeTable() function for opening attribute table of a vector layer:
uri = "D:/Python_QGIS/data/Countries.shp"
vlayer = QgsVectorLayer(uri, "Countries", "ogr")

iface.showAttributeTable(vlayer)
8- Iterating over a layer
Load a raster layer:
uri = "D:/Python_QGIS/data/dem_subset.tif"
rlayer = iface.addRasterLayer(uri, "my_raster", "gdal")
Check if the raster layer is valid or not:
if rlayer.isValid():
    print("Great this is a valid raster layer!")
else:
    print("This is invalid raster layer!")
9- Create a vector layer and add fields to it.
Firstly, create a new QgsVectorLayer
vl = QgsVectorLayer("Point", "shapefile", "memory")
Add attribute table
from qgis.PyQt.QtCore import QVariant
pr = vl.dataProvider()
pr.addAttributes([QgsField("City", QVariant.String),
                  QgsField("Population",  QVariant.Int),
                  QgsField("Area", QVariant.Double)])
Use updateFields() to fetch changes from the provider
vl.updateFields()

fet = QgsFeature()
fet.setGeometry(QgsGeometry.fromPointXY(QgsPointXY(44.01,36.19)))
fet.setAttributes(["Erbil", 2000000, 300])
pr.addFeature(fet)
After new features have been added, we update layer's extent
vl.updateExtents()
QgsProject.instance().addMapLayer(vl)
Add a list of items to the fields
vl = QgsVectorLayer("Point", "Cities_Kurdistan", "memory")

from qgis.PyQt.QtCore import QVariant
pr = vl.dataProvider()
pr.addAttributes([QgsField("City", QVariant.String),
                  QgsField("Population",  QVariant.Double),
                  QgsField("Area", QVariant.Double)])
vl.updateFields()

QgsProject.instance().addMapLayer(vl)
Add a list of items:
f1 = QgsFeature()
f1.setAttributes(['Erbil', '2932800', '14872'])
f1.setGeometry(QgsGeometry.fromPointXY(QgsPointXY(44.01,36.19)))

f2 = QgsFeature()
f2.setAttributes(['Sulaymania', '1967000', '20143'])
f2.setGeometry(QgsGeometry.fromPointXY(QgsPointXY(45.43,35.55)))

f3 = QgsFeature()
f3.setAttributes(['Duhok', '1292535', '10955'])
f3.setGeometry(QgsGeometry.fromPointXY(QgsPointXY(42.99,36.86)))

f4 = QgsFeature()
f4.setAttributes(['Halabja', '109000', '889'])
f4.setGeometry(QgsGeometry.fromPointXY(QgsPointXY(45.98,35.17)))

vl.dataProvider().addFeatures([f1, f2, f3, f4])

vl.updateExtents()
10- Appearance of Vector Layers
Download the data
Then, load the point type shapefile
uri = "D:/Python_QGIS/data/KRG_Cities.shp"
vlayer = iface.addVectorLayer(uri, "KRG_Cities", "ogr")
Change the size of the circle
vlayer.renderer().symbol().setSize(8)
vlayer.triggerRepaint()
Change the color of the symbol
vlayer.renderer().symbol().setColor(QColor("green"))
vlayer.triggerRepaint()
Change circles to other symbols
vlayer.renderer().symbol().symbolLayer(0).setShape(QgsSimpleMarkerSymbolLayerBase.Pentagon)
vlayer.triggerRepaint()
11- Run processing
uri = "D:/Python_QGIS/data/KRG_Cities.shp"
Using run()
processing.run("native:buffer", {'INPUT': uri,
               'DISTANCE': 100.0,
               'SEGMENTS': 10,
               'DISSOLVE': True,
               'END_CAP_STYLE': 0,
               'JOIN_STYLE': 0,
               'MITER_LIMIT': 10,
               'OUTPUT': 'D:/Python_QGIS/data/buffers.shp'})
Using runAndLoadResults()
processing.runAndLoadResults("native:buffer",
                {'INPUT':uri,
                'DISTANCE':1,
                'SEGMENTS':5,
                'END_CAP_STYLE':0,
                'JOIN_STYLE':0,
                'MITER_LIMIT':2,
                'DISSOLVE':False,
                'OUTPUT':'memory:'})
12- Map Printing

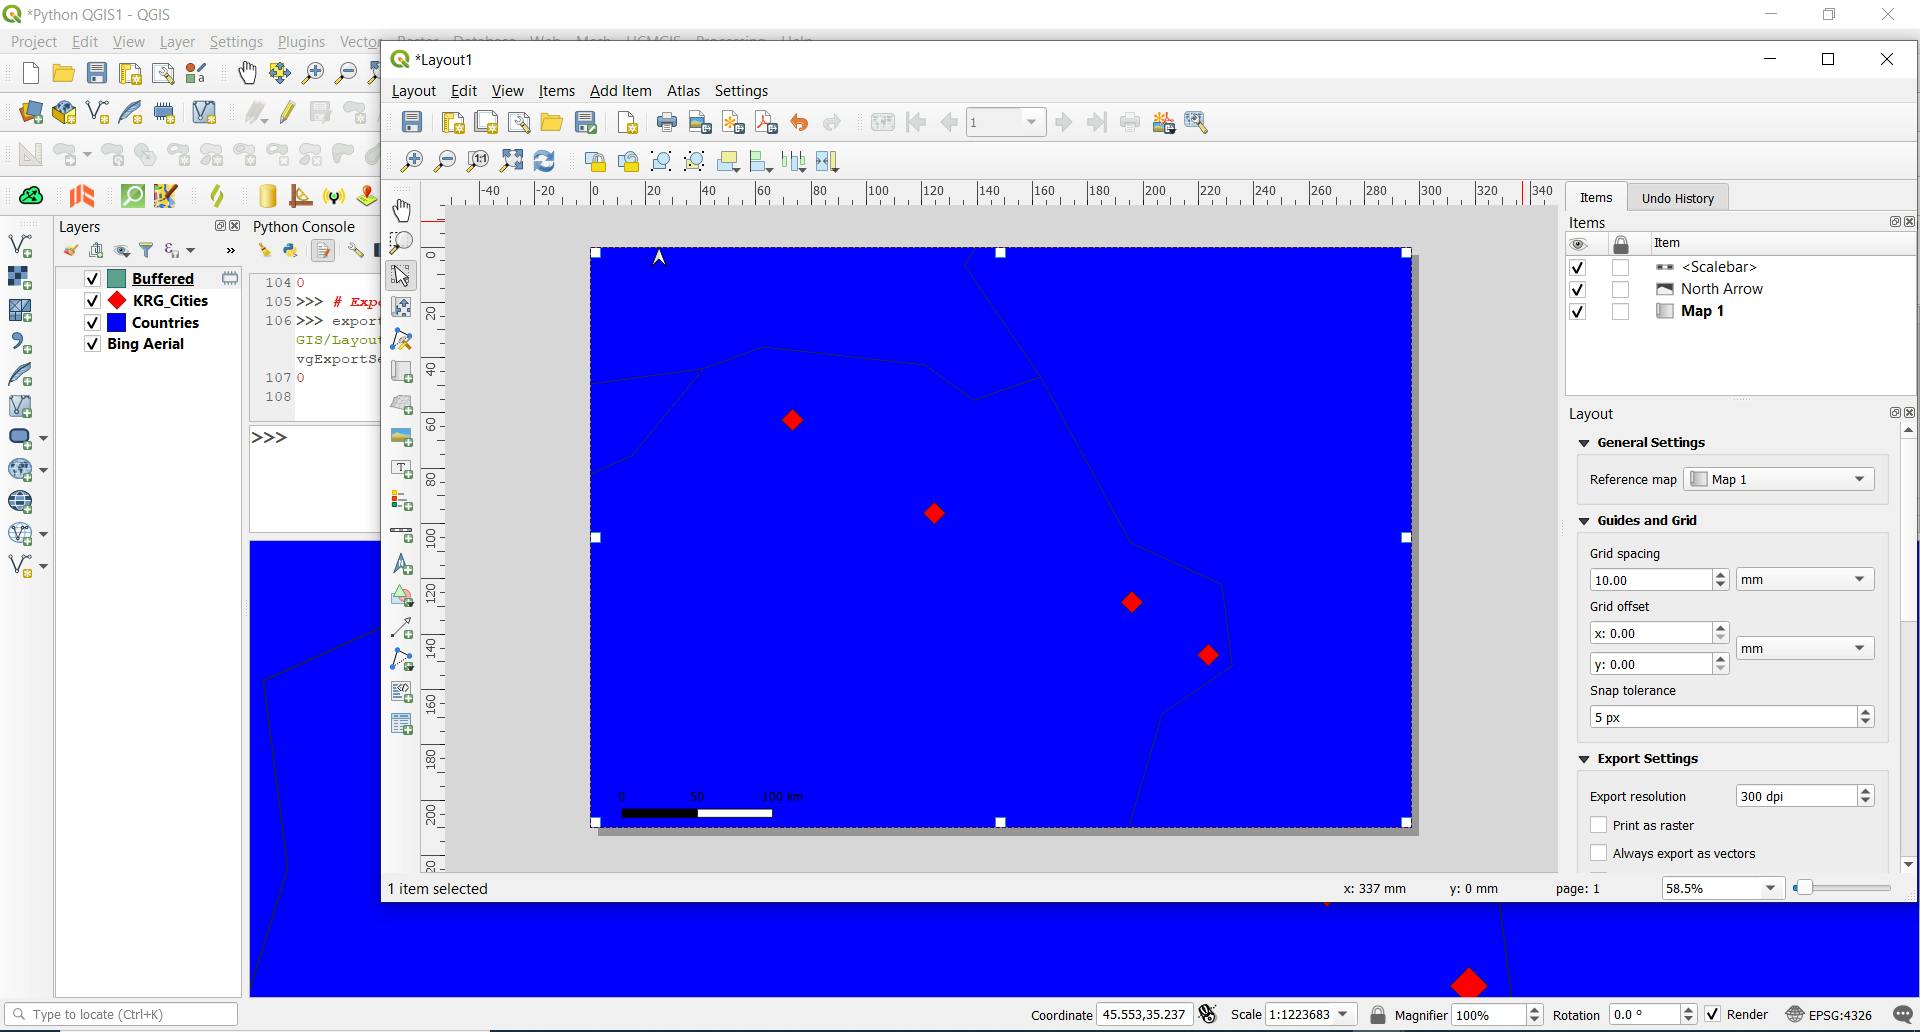
We use QgsLayoutExporter(), class, to export a layout that we opened
manager = QgsProject.instance().layoutManager()
print(manager.printLayouts())

layout = manager.layoutByName("Layout1")
we use QgsLayoutExporter() to export to image, SVG, and PDF
exporter = QgsLayoutExporter(layout)
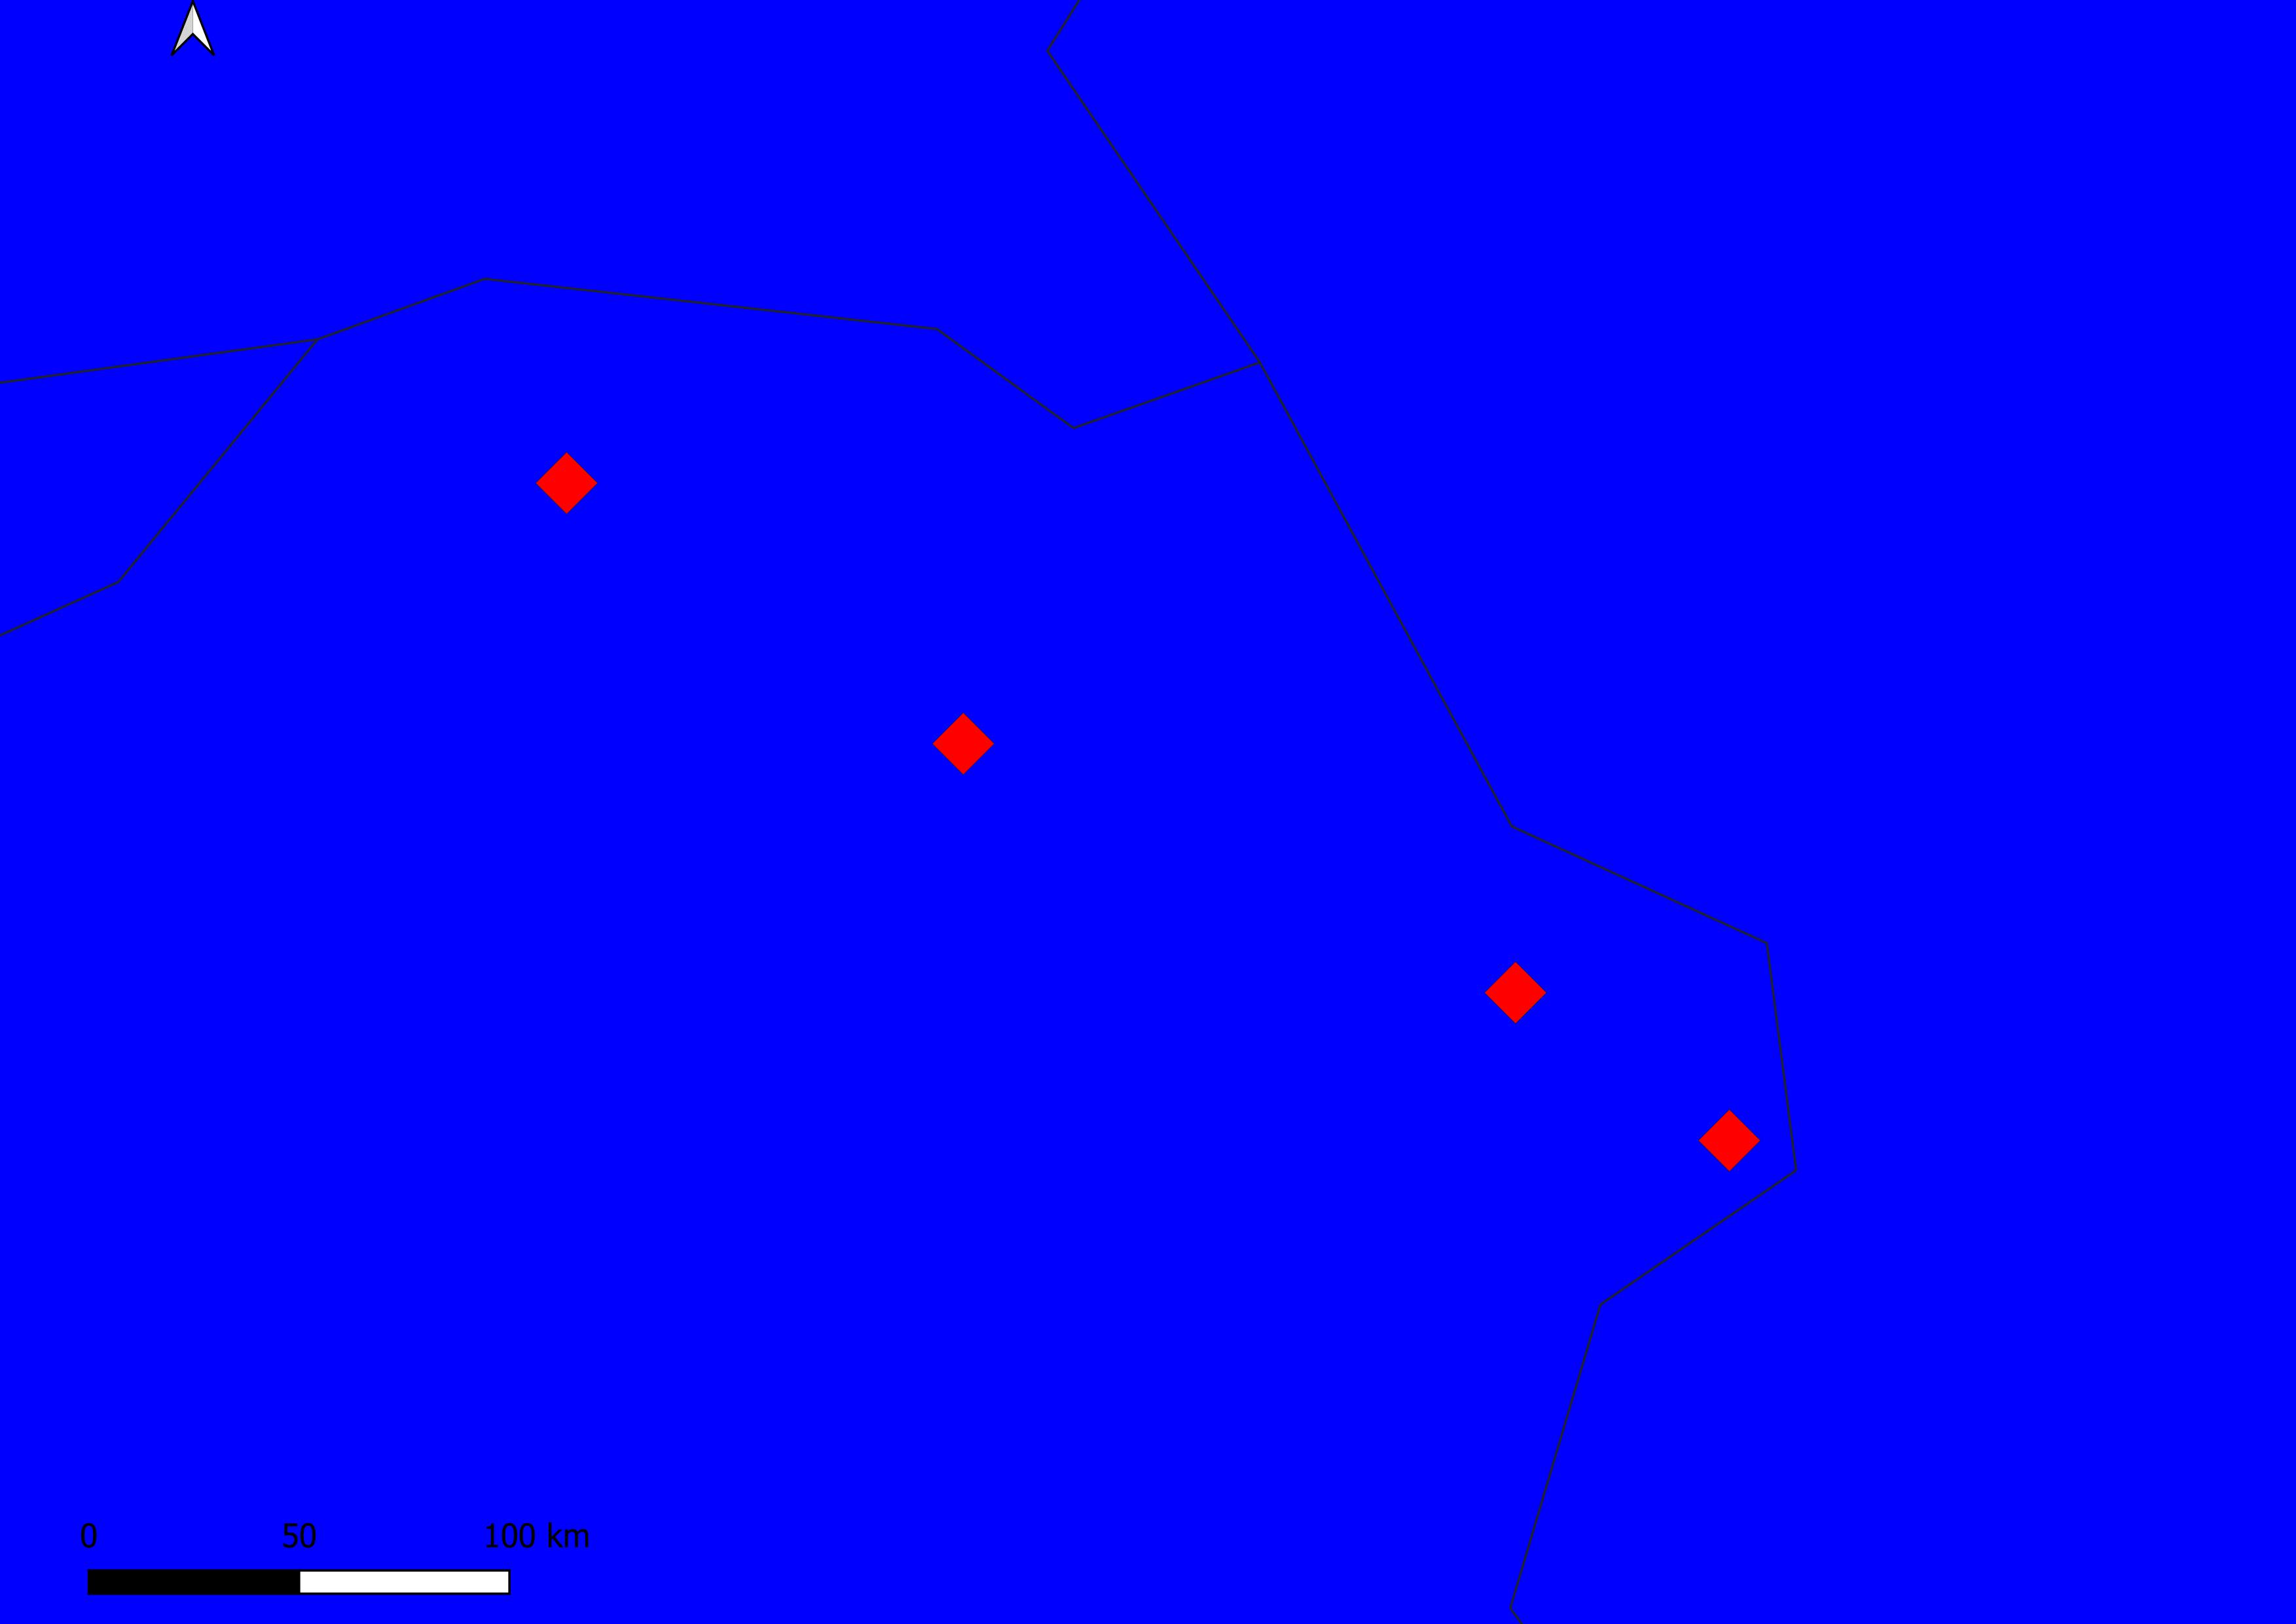
Export to png image
exporter.exportToImage("D:/Python_QGIS/Layout1.png", QgsLayoutExporter.ImageExportSettings())
 Export to pdf
exporter.exportToPdf("D:/Python_QGIS/Layout1.pdf", QgsLayoutExporter.PdfExportSettings())
Export to svg image
exporter.exportToSvg("D:/Python_QGIS/Layout1.svg", QgsLayoutExporter.SvgExportSettings())
Using for loop to export layout
for layout in manager.printLayouts():
    exporter = QgsLayoutExporter(layout)
    exporter.exportToImage("D:/Python_QGIS/Image2.png".format(layout.name()),
        QgsLayoutExporter.ImageExportSettings())
13- Chaining Processings
Download the data
Loading shapefiles of roads and some places of Erbil city in Iraq
roa = "D:/erbil_data/erbil_data/roads.shp"
pla = "D:/erbil_data/erbil_data/places.shp"
Choose only primary roads from the roads shapefile
expression = "fclass = 'primary'"

primary_roads = processing.run("native:extractbyexpression",
    {"INPUT":roa, "EXPRESSION":expression,"OUTPUT":"memory:"}
    )["OUTPUT"]
Create a buffer around primary roads
buffered_primary_roads = processing.run("native:buffer",
    {'INPUT':primary_roads,'DISTANCE':0.01,'SEGMENTS':5,'END_CAP_STYLE':0,
    'JOIN_STYLE':0,'MITER_LIMIT':2,'DISSOLVE':False,'OUTPUT':'memory:'}
    )['OUTPUT']
Add the layer of buffered_primary_roads
QgsProject.instance().addMapLayer(buffered_primary_roads)
Find places along primary rods
places_along_primary_roads = processing.run("native:extractbylocation",
    {"INPUT": pla, "PREDICATE": [0], "INTERSECT":buffered_primary_roads, "OUTPUT": "memory:"}
    )['OUTPUT']
QgsProject.instance().addMapLayer(places_along_primary_roads)
Print the name of places along primary roads
for feature in places_along_primary_roads.getFeatures():
    print(feature["name"])
14- Managing Project Layers
import processing
uri = "D:/Python_QGIS/data/places.shp"
vlayer = iface.addVectorLayer(uri, "Places", "ogr")
Useing runAndLoadResults() function to create buffer
processing.runAndLoadResults("native:buffer", {'INPUT':uri,'DISTANCE':0.1,'SEGMENTS':5,'END_CAP_STYLE':0,'JOIN_STYLE':0,'MITER_LIMIT':2,'DISSOLVE':False,'OUTPUT':'memory:'})

project = QgsProject.instance()
print(project.mapLayers())
It returns: {'output_1a4a410f_b372_49ca_87d4_e6aeba988509': , 'places_a7c9b8cb_2aee_47e0_8101_5caf81e9607c': }
Print name of layers with for loop
for id, layer in project.mapLayers().items():
    print(layer.name())
Rename a layer
rename = project.mapLayersByName('Buffered')[0]
rename.setName('Renamed!')
Remove a layer
delete = project.mapLayersByName('Places')[0]
project.removeMapLayer(delete.id())
15- Compute new field values of attribute table
Create vector layer
vl = QgsVectorLayer("Point", "Cities_Kurdistan", "memory")

from qgis.PyQt.QtCore import QVariant
pr = vl.dataProvider()
Add an attributed table to it
pr.addAttributes([QgsField("City", QVariant.String),
                  QgsField("Population",  QVariant.Double),
                  QgsField("Area", QVariant.Double),
                  QgsField("Density", QVariant.Double)])
vl.updateFields()

QgsProject.instance().addMapLayer(vl)
Define data
my_data = [
    {'x': 44.01, 'y': 36.19, 'City': 'Erbil', 'Population': 2932800, 'Area': 14872},
    {'x': 45.43, 'y': 35.55, 'City': 'Sulaymania', 'Population': 1967000, 'Area': 20143},
    {'x': 42.99, 'y': 36.86, 'City': 'Duhok', 'Population': 1292535, 'Area': 10955},
    {'x': 45.98, 'y': 35.17, 'City': 'Halabja', 'Population': 109000, 'Area': 889}]
Add data to the fields
for rec in my_data:
    f = QgsFeature()
    pt = QgsPointXY(rec['x'], rec['y'])
    f.setGeometry(QgsGeometry.fromPointXY(pt))
    f.setAttributes([rec['City'], rec['Population'], rec['Area']])
    pr.addFeature(f)

vl.updateExtents()
QgsProject.instance().addMapLayer(vl)
The density field is empty and we compute it with for loop
with edit(vl):
    for f in vl.getFeatures():
        f['Density'] = f['Population'] / f['Area']
        vl.updateFeature(f)