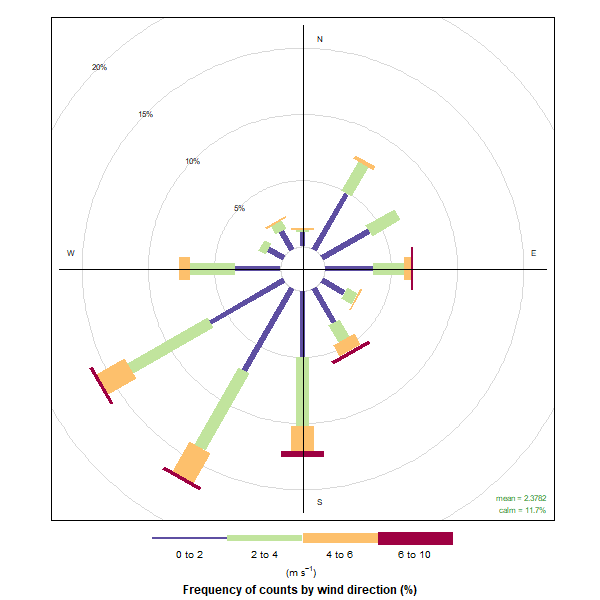
17- Wind Rose Plots for Different Time Periods
This code showcases the creation of wind rose plots for different time periods, using worldmet and openair packages, including wind rose plots for the entire period, specific months, and seasonal wind

Search for a command to run...
Articles tagged with #r
This code showcases the creation of wind rose plots for different time periods, using worldmet and openair packages, including wind rose plots for the entire period, specific months, and seasonal wind

In this blog post, we'll explore how to import and analyze annual weather data using R programming. The focus will be on a specific weather station with the code "406210-99999" in Kirkuk. We'll calcul

Looking for ways to create animated graphs in R programming? Check out this tutorial that provides step-by-step instructions on how to use various R libraries to create animated timelines, scatterplots, boxplots, violin plots, and more. You'll also f...

Load trees data from datasets library library(datasets) tr<-trees head(tr) Histogram hist(tr$Volume, col = 'darkred',main="Your title", xlab="Volume") Barplot barplot(tr$Height, names.arg=c(1:31), col='darkgreen') Boxplot boxplot(tr$Height, col...

Install and load packages (DataExplorer, datasets, ggplot2): #install.packages("DataExplorer") # Load library library(DataExplorer) # load DataExplorer library(datasets) library(ggplot2) Download the data files LAI_factors.csv and Countries_LAI_and_...

Multiple linear regression (MLR) example: fit <- lm(y ~ x1 + x2 + x3, data = mydata) Download the data used in this tutorial. Load data: df<- read.csv("D:\\R4Researchers\\LAI_factors.csv") View(df) head(df) Rename some long column names: library(ti...